CADJPY shows a bullish sequence from the August 02 2022 low suggesting further upside is likely. The Rally from the August 02 low is unfolding as an impulse Elliott Wave structure. high from August 02 down, wave 1 ended at 105.100, and the decline in wave 2 ended at 102.600 as the 1-hour chart below shows. Pair has resumed higher in wave 3 which subdivides into another impulse to a minute degree.
low from wave 2, wave ((i)) ended at 106.800, and the decline in wave ((ii)) ended at 105.460. The internal subdivision of wave ((ii)) took the form of a zig-zag. Up from wave ((i)), wave (a) ended at 105.580, wave (b) ended at 106.100, and wave (c) of ((ii)) ended at 105.460. The pair then turned higher in wave ((iii)). Near term, as far as pivot at 102.600 low stays intact, expect the decline to fail in 3, 7, or 11 swings for further upside. The potential target high is 100% – 161.8% Fibonacci extension from 8.02.2022 up at 106.280 – 108.570 and already reached but still, we don’t get wave 3 minor degree because the rally has created extension in the meantime we can see further upside, Elliott wave view: CADJPY Should Continue to Extend Higher.
Index Funds and ETFs: The greatest contrast between ETFs and index funds is that ETFs can be traded over the
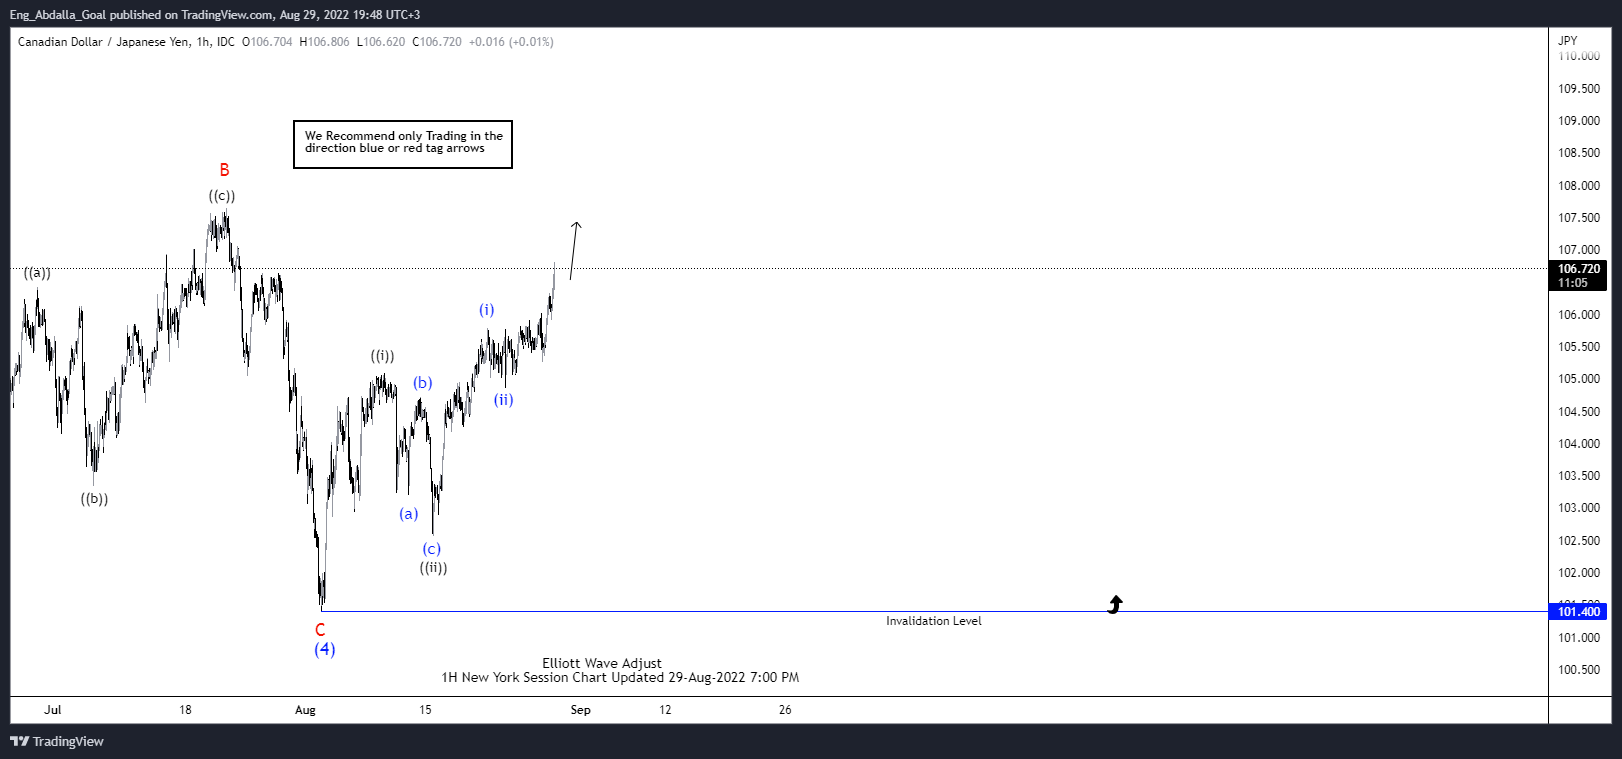
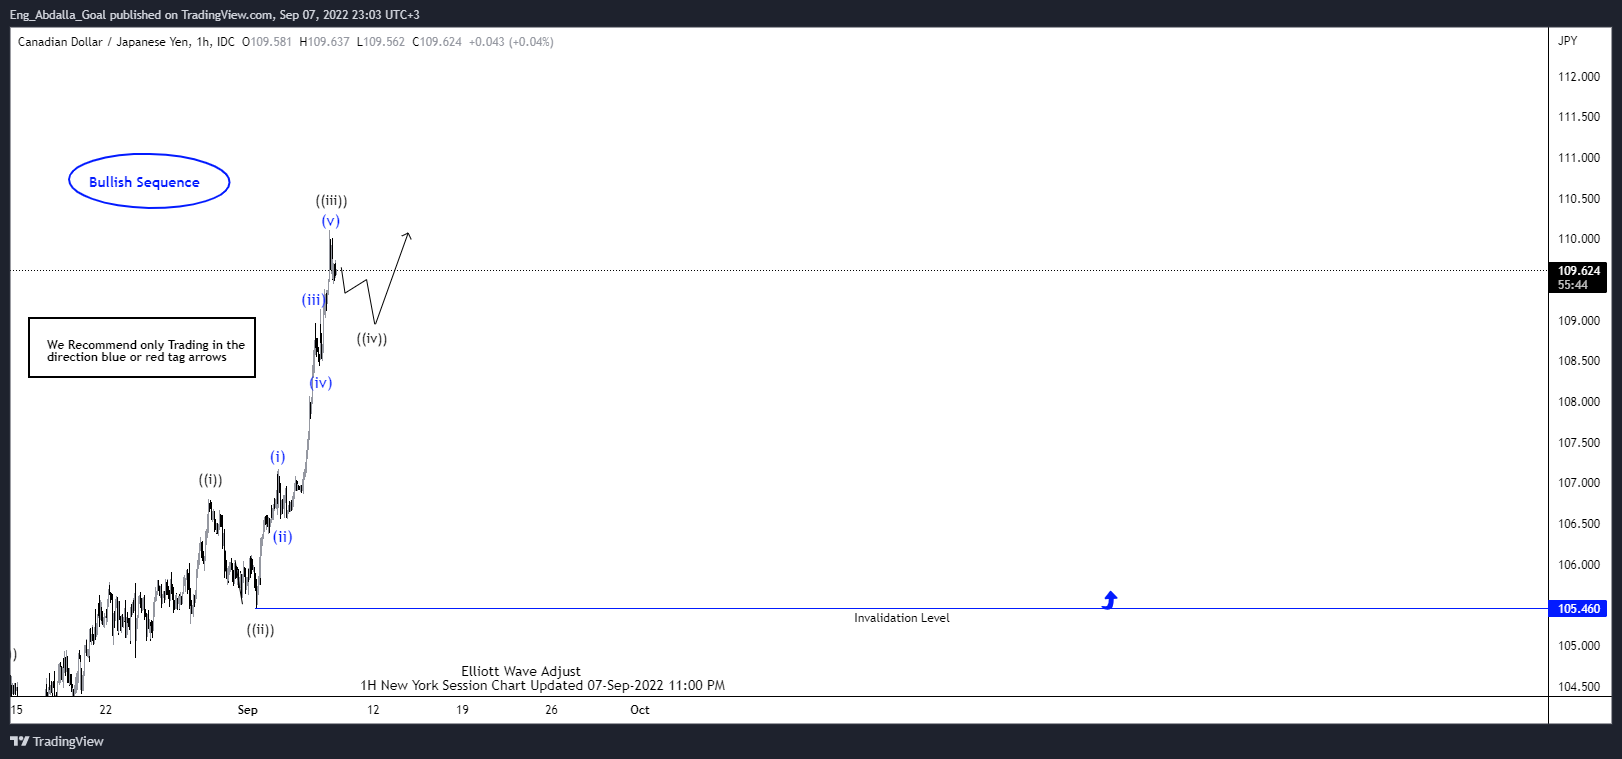
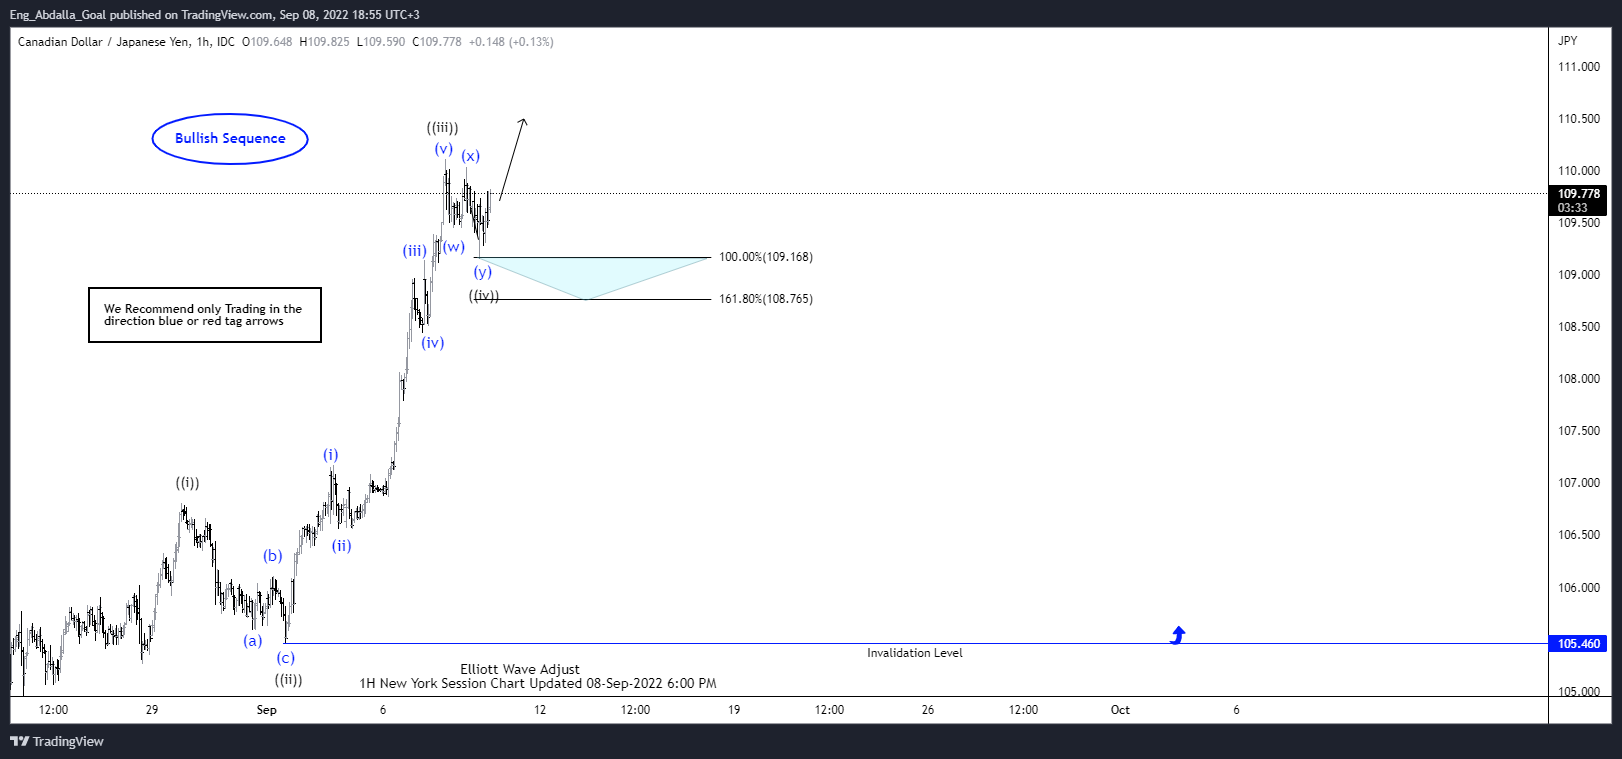
Elliott Wave Theory has been a cornerstone in the world of technical analysis, providing traders and investors with a unique
Trading Psychology: Many experienced traders say that the most troublesome test they face while turning into a broker is defeating
Role of The Central Bank: A central bank is a financial organization that supervises a country's money-related system, including cash
Elliott Wave Theory is a powerful tool that traders and investors use to forecast market movements with great accuracy. In
Candlestick patterns are important in trading analysis. They show market sentiment and potential price changes. Knowing these patterns helps traders