
“Dear Traders,
In this technical article, we’re going to take a look at the Elliott Wave charts of NZDUSD, which are thoughtfully presented in the exclusive member’s area on our website. Recently, NZDUSD has given us a correction that has unfolded as an Elliott Wave Zigzag pattern. It has reached an extreme area (buying zone) and made a rally from there. In the following text, we are going to explain the Elliott Wave pattern and Forecast.
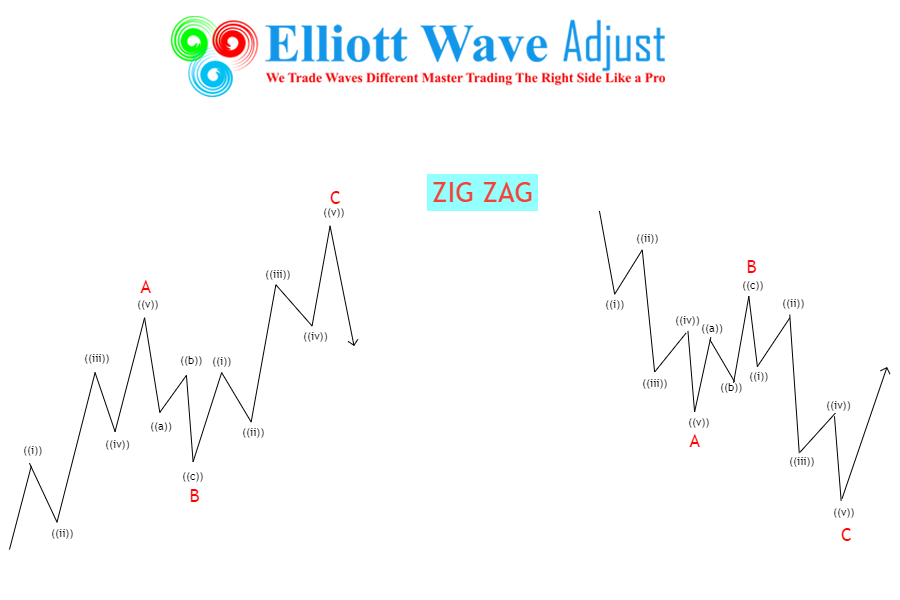
Before we take a look at the real market example, let’s explain Elliott Wave Zigzag pattern.
Now it is too close entry area The NZDUSD is giving us wave 2 pullbacks still on the process and needs to find buyers again, NZDUSD already shows a clear 3 swings pattern from the peak, reaching the extreme zone. We still could see more short-term weakness in wave (c) of ((X)) toward the 0.58620 – 0.58050 area. The current view suggests buyers should ideally appear at the marked zone for a further rally or 3 waves bounce at least. We don’t recommend selling.
NZDUSD 1 Hour Elliott Wave Analysis Nov, 14 2023
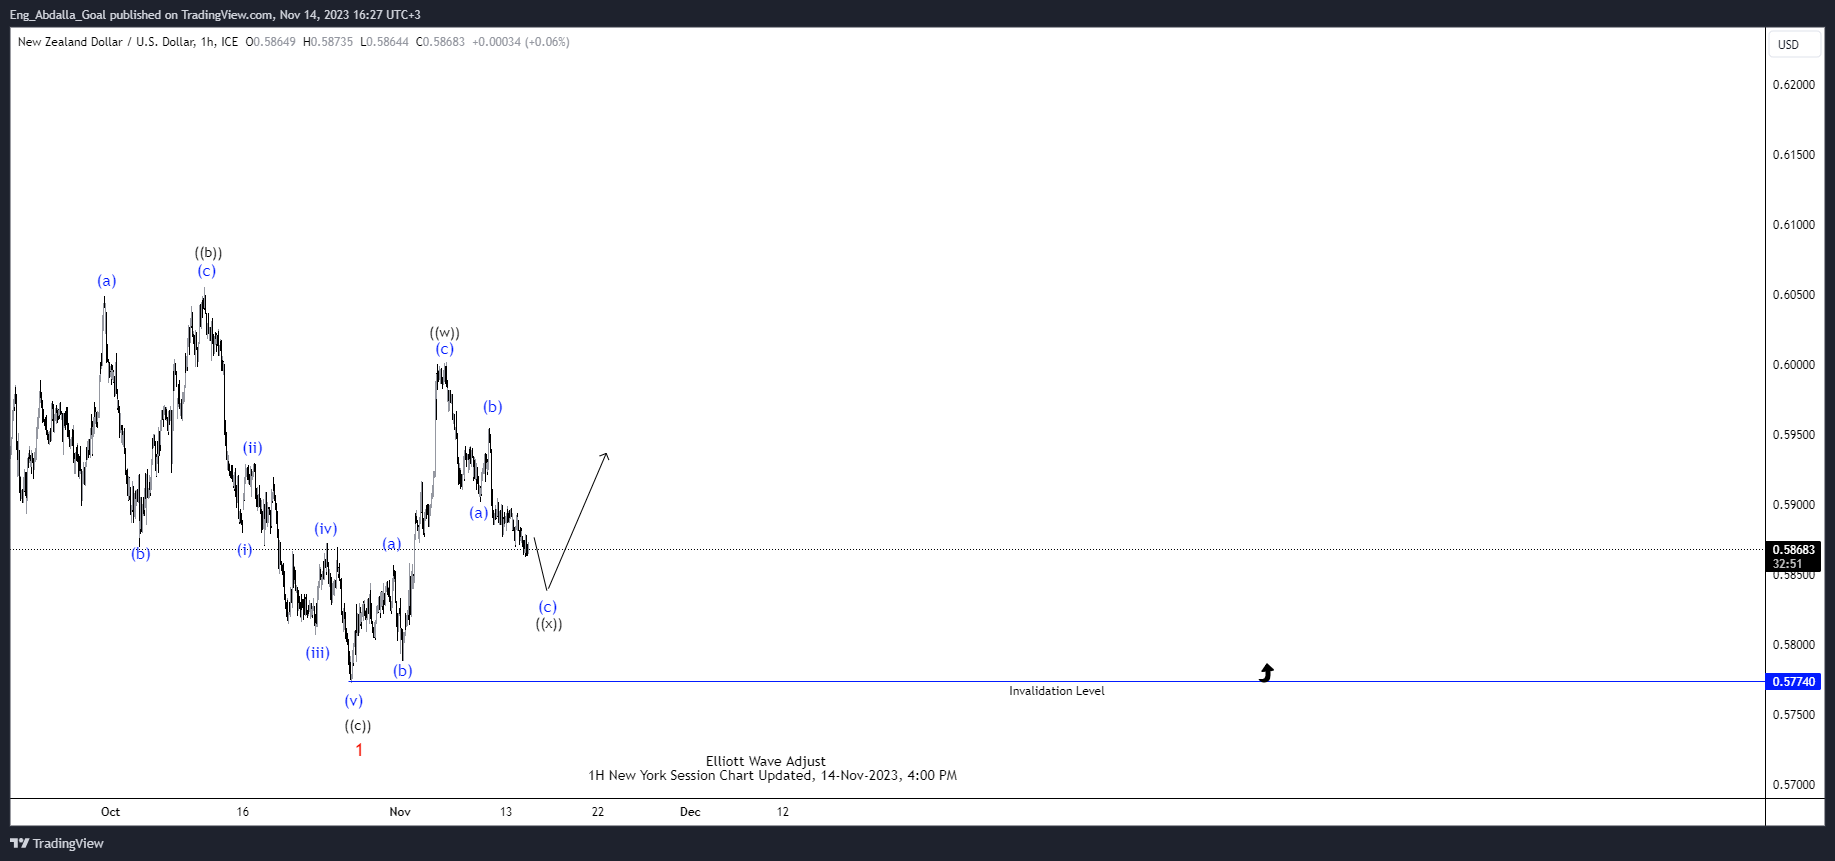
The NZDUSD is giving us wave 2 pullbacks that is unfolding as a Three Swing. NZDUSD already shows a clear 3 swings from the low and still remaining waves ,6 and 7, reaching the extreme zone. We still could see more short-term Strength in wave ((y)) of 2 toward the 0.610000 area.
Now it is too close entry area The EURAUD is giving us wave (4) blue pullback that is unfolding as a Double Three pattern. EURAUD already shows a clear 7 swings pattern from the peak, reaching the extreme zone. We still could see more short-term weakness in wave ((c)) of Y toward the 0.58620 – 0.58050 area. The current view suggests buyers should ideally appear at the marked zone for a further rally or 3 waves bounce at least. We don’t recommend selling.
NZDUSD 1 Hour Elliott Wave Analysis Nov 16, 2023

We got another marginal push down as expected. Buyers appeared at the marked extreme zone and we are getting a good reaction from there. Pullback completed at the 0.58620 low. The rally from the buyer’s zone looks like 3 waves which suggests after 3 waves pull back it should ideally see further continuation higher. It’s important that 0.58620 pivot holds during the expected pullback in order to hold the presented view intact.
Keep in mind that the market is dynamic and the presented view could have changed in the meantime. You can check the most recent charts in the membership area of the site. The best instruments to trade are those having incomplete bullish or bearish swing sequences. We put them in Sequence Report and the best among them are shown in the Live Trading Room.
We cover over 20+ instruments in total, but not every chart is a trading recommendation. We present Official Trading Recommendations in Live Trading Room
If you are not a member yet, Sign Up now and get access to new trading opportunities. Through time we have developed a very respectable trading strategy that defines Entry, Stop Loss and Take Profit levels with high accuracy.
Stay tuned for an in-depth analysis.


