Pivot Points Calculator
Pivot Points Calculator
Our Pivot Points Calculator helps you determine key support and resistance levels based on the previous trading day’s high, low, and closing prices. Pivot points are essential tools used by traders to identify potential entry and exit points for their trades.
Key Inputs:
- Previous Day’s High: Enter the highest price traded during the previous trading day.
- Previous Day’s Low: Enter the lowest price traded during the previous trading day.
- Previous Day’s Close: Enter the closing price of the previous trading day.
Calculated Pivot Points:
Pivot Point (PP): The central pivot point calculated as:
PP=Previous Day’s High+Previous Day’s Low+Previous Day’s Close3\text{PP} = \frac{\text{Previous Day’s High} + \text{Previous Day’s Low} + \text{Previous Day’s Close}}{3}PP=3Previous Day’s High, Previous Day’s Low, and Previous Day’s CloseSupport and Resistance Levels:
Support 1 (S1) and Resistance 1 (R1): Levels around the pivot point that are likely to act as support or resistance.
S1=2×PP−Previous Day’s High\text{S1} = 2 \times \text{PP} – \text{Previous Day’s High}S1=2×PP−Previous Day’s High R1=2×PP−Previous Day’s Low\text{R1} = 2 \times \text{PP} – \text{Previous Day’s Low}R1=2×PP−Previous Day’s LowSupport 2 (S2) and Resistance 2 (R2): Secondary support and resistance levels.
S2=PP−(Previous Day’s High−Previous Day’s Low)\text{S2} = \text{PP} – (\text{Previous Day’s High} – \text{Previous Day’s Low})S2=PP−(Previous Day’s High−Previous Day’s Low) R2=PP+(Previous Day’s High−Previous Day’s Low)\text{R2} = \text{PP} + (\text{Previous Day’s High} – \text{Previous Day’s Low})R2=PP+(Previous Day’s High−Previous Day’s Low)Support 3 (S3) and Resistance 3 (R3): Additional levels if the price breaks through S2 or R2.
S3=Previous Day’s Low−2×(Previous Day’s High−PP)\text{S3} = \text{Previous Day’s Low} – 2 \times (\text{Previous Day’s High} – \text{PP})S3=Previous Day’s Low−2×(Previous Day’s High−PP) R3=Previous Day’s High+2×(PP−Previous Day’s Low)\text{R3} = \text{Previous Day’s High} + 2 \times (\text{PP} – \text{Previous Day’s Low})R3=Previous Day’s High+2×(PP−Previous Day’s Low)
Usage Tips:
- Trading Strategy: Use pivot points to identify potential levels for entering or exiting trades.
- Intraday Analysis: Recalculate pivot points daily for intraday trading strategies.
- Technical Analysis: Combine pivot points with other technical indicators for comprehensive market analysis.
Benefits:
- Objective Levels: Provides objective support and resistance levels based on previous price action.
- Decision Support: Helps traders make informed trading decisions based on key price levels.
- Versatility: Applicable to various financial markets, including stocks, forex, commodities, and indices.
How to use:
- Enter the previous day’s high, low, and close prices.
- Click ‘Calculate’ to generate pivot points and support/resistance levels.
- Use the calculated levels to plan your trading strategy and manage risk effectively.
Enhance your trading strategy with our Pivot Points Calculator to identify strategic entry and exit points in the market.

Which Currency Pairs Are Best for Elliott Wave Traders in 2024?
In 2024, Elliott Wave Theory will remain a pivotal tool for traders navigating the complexities of financial markets. For forex traders, understanding the optimal currency pairs can significantly enhance their
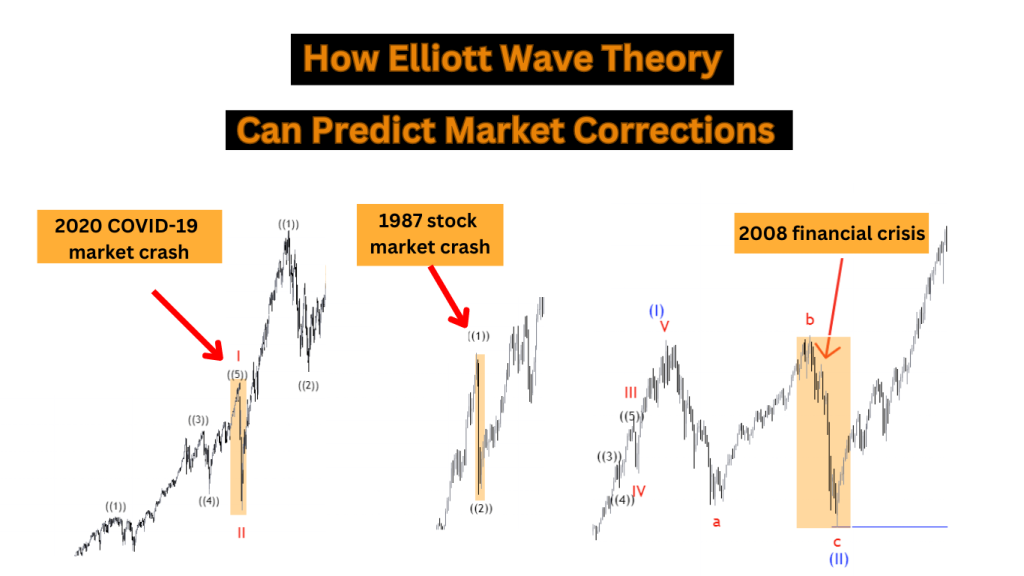
How Elliott Wave Theory Can Predict Market Corrections
Elliott Wave Theory is a powerful tool that traders and investors use to forecast market movements with great accuracy. In the financial markets, predicting market corrections is crucial for maximizing

Machine Learning and Elliott Wave Theory: A New Frontier
In the constantly changing world of financial analysis, Machine Learning (ML) and Elliott wave theory (EWT) are becoming essential tools. Combining these two methods could transform market forecasting, providing exceptional

Top 10 Common Mistakes in Elliott Wave Analysis You MUST Avoid!
Elliott wave analysis is a crucial part of technical analysis. It helps traders and investors understand market trends and potential price changes. Essentially, it says that market prices follow specific

From Novice to Pro: The Ultimate Guide to Cryptocurrency Trading
Cryptocurrency trading has become more than just a trend; It is a global phenomenon that has attracted the attention of both experienced investors and newcomers alike. In this comprehensive guide,
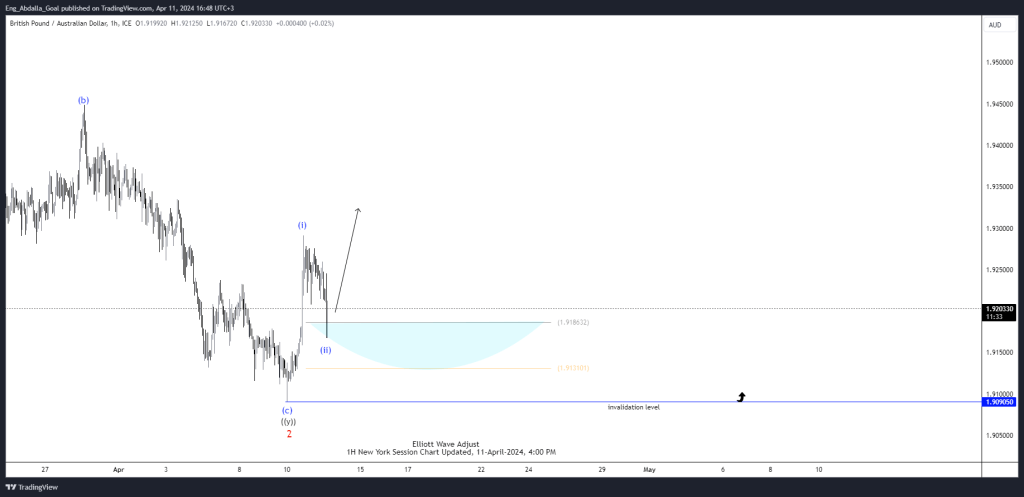
GBPAUD Elliott Wave View: Buyers have taken control after completing the Double-Three Structur
In this technical article we’re going to take a quick look at the Elliott Wave charts of GBPAUD published in members area of the website. Our team recommended members to


