Elliott Wave Theory is a powerful tool that traders and investors use to forecast market movements with great accuracy.
In the financial markets, predicting market corrections is crucial for maximizing returns and minimizing losses. One of the most influential tools for this is the Elliott Wave Theory, a method that has proven its reliability over time.
In this blog post, we’ll explore how Elliott Wave Theory can help predict market corrections. For an introduction and history of the theory, check out these articles: Elliott Wave Theory or Mastering Elliott Wave Theory.
The core idea of Elliott Wave Theory is that market prices move in predictable patterns because of collective investor psychology. The theory identifies two types of waves: impulsive waves, which move in the direction of the main trend, and corrective waves, which move against it. These waves form larger patterns that reflect the natural ebb and flow of market sentiment.
importance of Market Predictions
Impact on Investors and Traders
Accurate market predictions can greatly influence investment strategies. By predicting market corrections, investors can decide when to enter or exit positions. This can result in significant gains or help avoid losses, improving overall portfolio performance.
Role in Financial Decision-Making
Elliott Wave Theory helps analyze market trends and predict future movements. This is invaluable for financial decision-making, helping traders find profitable opportunities and manage risk better. By understanding wave patterns, investors can match their strategies with market cycles, optimizing their investment outcomes.
Understanding Elliott Wave Theory
The Foundational Principles
The Concept of Market Cycles
Elliott Wave Theory says that financial markets move in cycles driven by investor behavior. These cycles have two phases: the impulsive phase, where prices follow the main trend, and the corrective phase, where prices move against the main trend. Recognizing these cycles is essential for using Elliott Wave Theory effectively.
Wave Patterns: Impulsive and Corrective Waves
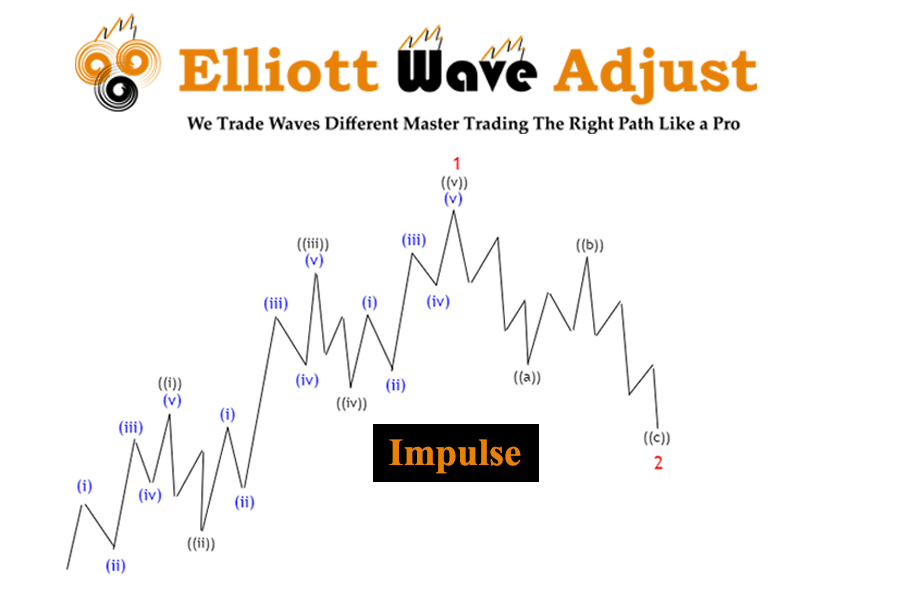
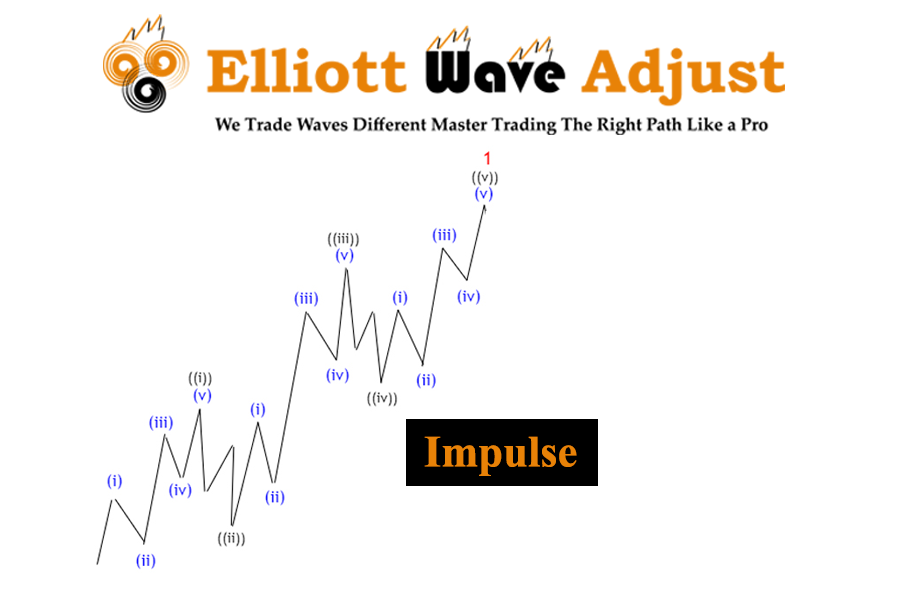
Impulsive waves show strong, directional movements and have five sub-waves. Corrective waves usually have three sub-waves and move against the main trend. These patterns repeat over different time frames, creating a fractal structure seen in all market movements. Understanding this structure helps traders and investors make better decisions based on market behavior.
The Elliott Wave Pattern
The Five-Wave Structure
In an impulsive wave, the market moves in a five-wave pattern. The first, third, and fifth waves move in the direction of the main trend, while the second and fourth waves are corrections within the larger trend. The third wave is usually the strongest and longest, reflecting a period of heightened market activity and investor confidence.
Three-Wave Corrective Pattern
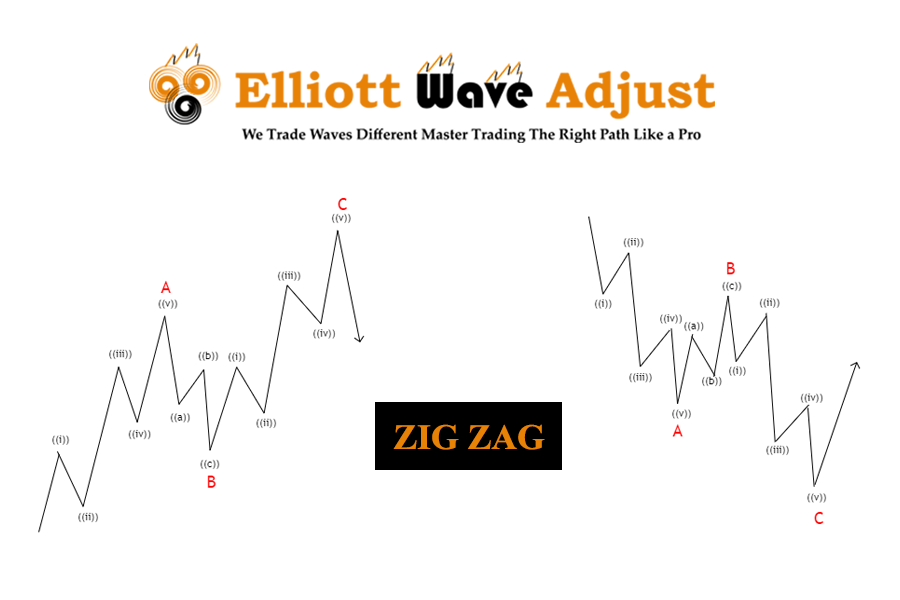
Corrective waves move against the main trend and usually have three waves, labeled A, B, and C. Wave A moves against the trend, Wave B partially retraces Wave A, and Wave C continues in the direction of Wave A. Understanding these patterns helps traders spot potential reversal points and continuation patterns.
Rules and Guidelines
Key Rules for Identifying Waves
To use Elliott Wave Theory correctly, follow these rules:
- Wave 2 cannot retrace more than 100% of Wave 1.
- Wave 3 cannot be the shortest among Waves 1, 3, and 5.
- Wave 4 cannot overlap the price area of Wave 1.
Following these rules ensures you identify wave patterns correctly, which is crucial for reliable market predictions.
Common Guidelines and Observations
While the rules are strict, these guidelines offer extra insights:
- Wave 3 is usually the longest and strongest wave.
- Wave 5 often has less momentum than Wave 3.
- Corrective patterns alternate; if Wave 2 is sharp, Wave 4 is likely to be flat.
These guidelines help refine your wave analysis, making your predictions more accurate and useful.
Psychology Behind Elliott Waves
Market Sentiment and Investor Behavior
Elliott Wave Theory is based on market psychology. It reflects the collective behavior of investors, driven by emotions like fear, greed, and hope. These emotions create consistent and predictable patterns over time. Understanding these psychological drivers can give deeper insights into market movements.
How Psychology Drives Wave Patterns
Investor sentiment cycles between optimism and pessimism. During optimistic phases, prices rise as more investors buy, creating impulsive waves. During pessimistic phases, prices fall as investors sell, leading to corrective waves. This cyclical behavior is the foundation of Elliott Wave Theory.
Applying Elliott Wave Theory to Market Corrections
Identifying Market Corrections
Definition of a Market Correction
A market correction is a decline of 10% or more in the price of a security or index from its recent peak. Corrections are natural parts of market cycles and can occur frequently without indicating a bear market.
Differences Between Corrections and Bear Markets
A market correction is a short-term decline of 10% or more. A bear market is a prolonged period of declining prices, usually defined as a decline of 20% or more from recent highs. Corrections are seen as healthy pullbacks that prevent overvaluation, while bear markets indicate more severe economic downturns.
Wave Patterns in Market Corrections
Typical Corrective Wave Patterns
Corrective waves in market corrections usually show as three-wave patterns labeled A, B, and C. Wave A is the initial decline, Wave B is a short-term recovery, and Wave C is the final leg of the correction. Recognizing these patterns can help traders anticipate the end of a correction and prepare for the next impulsive phase.
Case Studies of Past Corrections
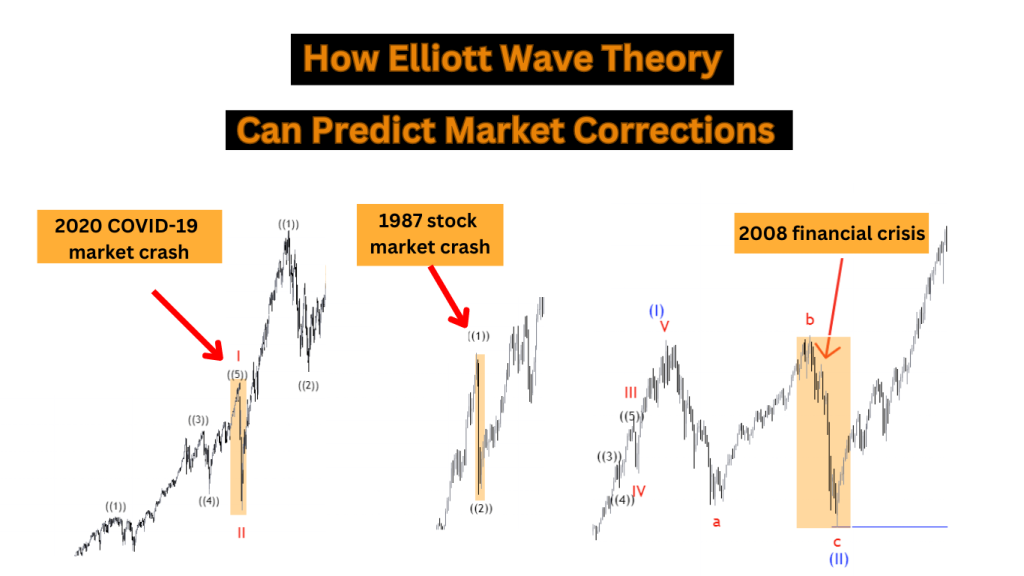
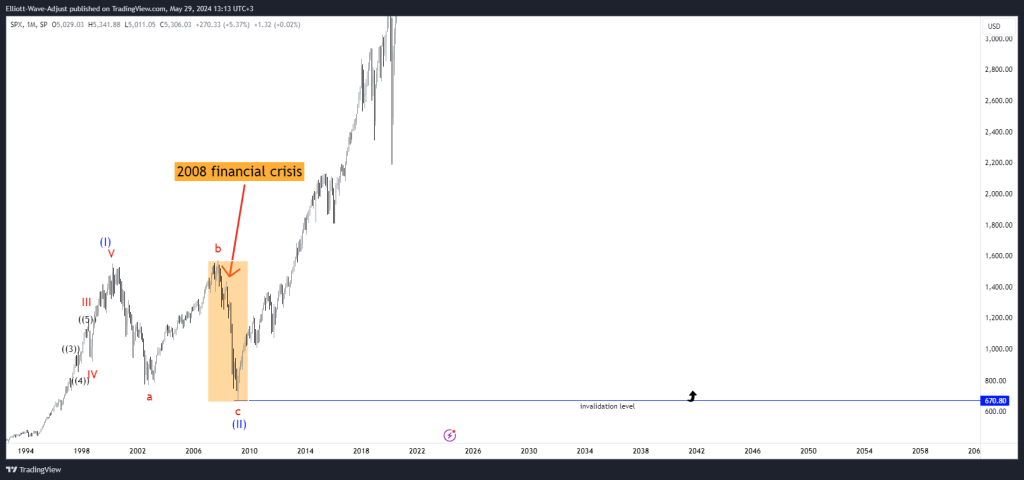
Historical examples teach valuable lessons on using Elliott Wave Theory. For instance, the 2008 financial crisis correction showed clear A, B, and C wave patterns. Analyzing these patterns helps investors navigate turbulent markets and make informed decisions.
Predicting Market Corrections
Analyzing Wave Patterns for Potential Corrections
By studying wave patterns, traders can spot signs of impending market corrections. A completed five-wave impulsive pattern often signals the start of a corrective phase. Monitoring these patterns across different time frames can provide early warnings of market corrections.
Indicators and Signals to Watch
Besides wave patterns, traders should watch for indicators like overbought or oversold conditions, divergence in momentum indicators, and key support or resistance levels. Combining these signals with Elliott Wave analysis can improve the accuracy of market correction predictions.
Tools and Techniques
Technical Analysis Tools
Charting Software and Platforms
Modern charting software and trading platforms offer powerful tools for Elliott Wave analysis. These platforms have features like automatic wave counting, Fibonacci retracement tools, and real-time data analysis. Popular charting software includes MetaTrader and TradingView.
You can also find manual Elliott wave counting charts on our website. We provide forecasting services for markets worldwide, including forex, commodities, and cryptocurrencies.
Integrating Elliott Wave Analysis with Other Tools
Combining Elliott Wave Theory with other technical analysis tools can give a better market view. For example, using moving averages, RSI, and MACD with wave analysis can confirm wave patterns and give additional trading signals.
Wave Counting Techniques
Step-by-Step Guide to Counting Waves
- Identify the trend direction: Figure out if the market is going up or down in a strong or corrective way.
- Label the waves: Start by labeling the first wave, then add numbers to each subsequent wave following Elliott Wave rules.
- Check for rule violations: Make sure your wave counts follow key rules, like not retracing more than 100% of the previous wave.
- Adjust as needed: If the market doesn’t behave as expected, revise your wave count and make changes.
Common Pitfalls and How to Avoid Them
Mistakes in wave counting include getting patterns wrong and not following the rules. To avoid these, practice regularly, use other indicators for confirmation, and stay open to changing your analysis.
Time Frames and Wave Degrees
Understanding Different Time Frames
Elliott Wave analysis works on various time frames, from short-term to long-term charts. Short-term traders look at small waves, while long-term investors study bigger waves. Each time frame gives a different view of market trends.
Degrees of Waves and Their Significance
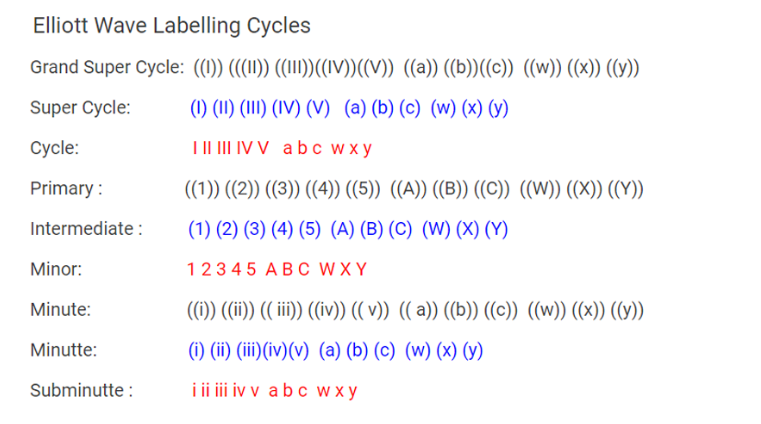
Waves come in various sizes, from small waves inside bigger ones to huge waves spanning decades. Recognizing these sizes helps traders see the bigger picture of the market and adjust their strategies accordingly.
Real-World Applications
There is no strategy like Elliott Wave Theory when it comes to anticipating market crashes with precision and reliability.
When it comes to foreseeing market crashes, no strategy compares to the predictive power of Elliott Wave Theory.
Elliott Wave Theory stands alone in its ability to predict market crashes, offering insights that other strategies simply cannot match.
Historical Examples
Major Market Corrections Predicted by Elliott Wave Theory
Elliott Wave Theory’s Success in Predicting Market Corrections
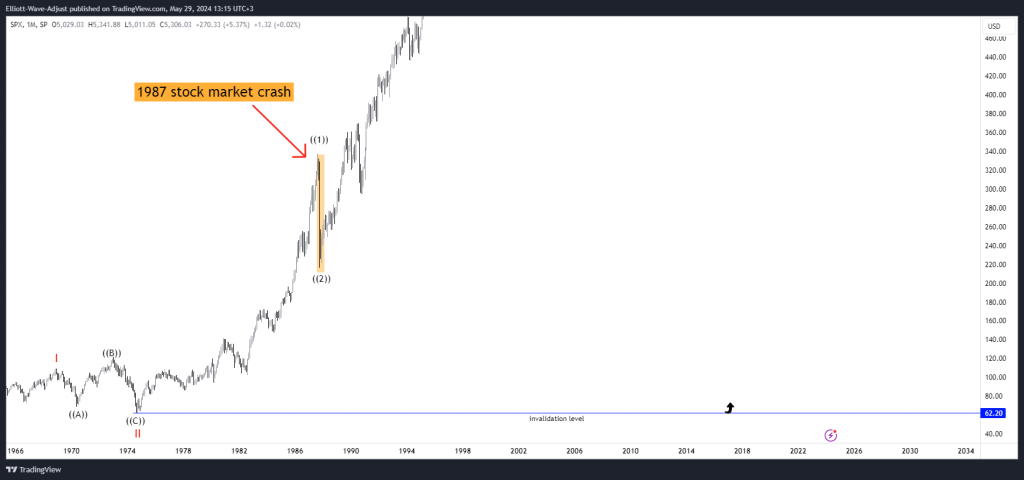
Elliott Wave Theory has accurately predicted many major market corrections. For instance, it forecasted the 1987 stock market crash and the burst of the 2000 dot-com bubble by showing clear wave patterns, giving smart traders early warnings.
Analyzing Predictions and Outcomes
Looking at past predictions confirms the effectiveness of Elliott Wave Theory. By studying these examples, traders can learn how to use wave analysis in today’s markets and make better predictions.
Case Studies
Detailed Examination of Specific Market Corrections
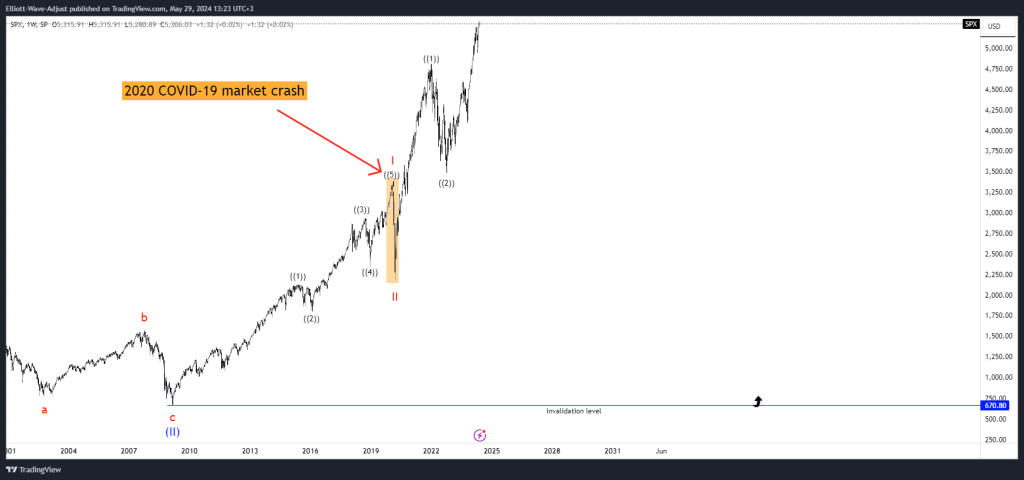
In-depth case studies of specific market corrections, such as the 2008 financial crisis,.
and the 2020 COVID-19 market crash demonstrate how Elliott Wave Theory can be applied in practice.
These case studies highlight the theory’s ability to provide actionable insights during turbulent market periods.
Application of Elliott Wave Theory in Each Case
Each case study looks at how traders used Elliott Wave patterns to handle market corrections. These real-world examples demonstrate how the theory can be applied in practice and provide important lessons for future market analysis.
Advanced Concepts
Extensions and Truncations
Identifying and Understanding Extensions
Extensions happen when one of the impulse waves, usually Wave 3, goes further than usual, making a stronger movement. Spotting extensions is crucial for counting waves accurately and predicting future prices.
Recognizing Truncations in Wave Patterns
Truncations occur when the fifth wave doesn’t go past the end of the third wave, showing a weak final movement. Knowing about truncations helps traders foresee potential trend changes and adjust their strategies.
Fibonacci Relationships
The Role of Fibonacci Ratios in Elliott Wave Theory
Fibonacci ratios are vital in Elliott Wave analysis. These ratios, like 38.2%, 50%, and 61.8%, help predict where prices might go and how much they might pull back. By using Fibonacci analysis, traders can improve how accurately they count waves and predict markets.
Applying Fibonacci Analysis to Predict Market Corrections
By using Fibonacci retracement and extension tools, traders can find important levels where corrective waves might turn around. This helps figure out when to enter or exit trades, making market correction predictions more accurate.
Combining Elliott Wave with Other Theories
Integrating Dow Theory, Gann Theory, and More
Bringing together Elliott Wave Theory with other market theories like Dow Theory and Gann Theory can make analysis stronger. Each theory gives different insights, and using them together can improve overall market understanding.
Benefits of a Multidisciplinary Approach
Using different theories lets traders check signals against each other, giving a fuller view of how the market works. This makes predictions more reliable and helps traders make smarter decisions.
Frequently Asked Questions (FAQs)
What is the Elliott Wave Theory?
Elliott Wave Theory is a way of analyzing markets by spotting repeating wave patterns driven by how investors feel.
How Accurate is Elliott Wave Theory in Predicting Market Corrections?
It’s not perfect, but when used right, it’s good at predicting market corrections. It works even better when used with other analysis tools.
Can Elliott Wave Theory be Used for Short-Term Trading?
Yes, Elliott Wave Theory can be applied to short-term trading by analyzing wave patterns on shorter time frames, such as hourly or minute charts.
What are the limitations of Elliott wave theory?
Some limitations are how people count waves differently, unusual market behavior, and needing practice to use the theory well.
How Do I Get Started with Elliott Wave Theory?
Start by learning the basics, practice counting waves on old charts, and use charting software with Elliott Wave tools.
What Resources Are Available for Learning Elliott Wave Theory?
You can find books like “The Wave Principle” by Ralph Nelson Elliott, online courses, webinars, and articles on good financial websites like ours.
How Does Elliott Wave Theory Compare to Other Market Prediction Tools?
Elliott Wave Theory looks at markets in a special way, focusing on wave patterns. It works well with other tools like moving averages, RSI, and MACD for a better view of the market
Conclusion
Summary of Key Points
Elliott Wave Theory is a strong way to predict market corrections by looking at wave patterns and investor feelings. Using these ideas can really help with investments and market guesses.
Future of Elliott Wave Theory in Market Analysis
Elliott Wave Theory will likely stay important in market analysis. As software gets better and it’s combined with other methods, it’ll be even more helpful and easier to use.
Final Thoughts
Getting good at Elliott Wave Theory takes practice, but it’s worth it. It helps make better guesses about markets and makes trading strategies work better. By keeping at it, traders can handle the tricky world of financial markets better.

